General
Changes of signal values in the recorded bus traffic can be rendered graphically using a signal plot. Multiple signals can be monitored at the same time in one or more windows. A new signal plot can be created from the context menu of the tree view. To display values, please start the simulation or load a recording.
Navigation and cursor usage
You can use up to two cursors at the same time inside a plot window. All cursor functionality is available while simulation is running.
Left-click on the desired position inside the plot to set a cursor. The cursor is set to the time stamp closest to the clicked position. Using the LEFT ARROW and RIGHT ARROW keys, you can move the current cursor. If your plot window displays more than one signal, you can switch between these using the UP ARROW and DOWN ARROW keys. The currently selected signal will be highlighted in gray. Cursors are set and moved in all signals simultaneously.
You can move the cursors using the following key combinations:
•SHIFT + LEFT/RIGHT ARROW
moves the cursors left and right along the plot's X axis.
•ALT + LEFT/RIGHT ARROW
moves the cursor on the next signal value change in the recording.
•CTRL + LEFT/RIGHT ARROW
sets the cursor on the next sample point in the recording.
•HOME
positions the cursor at the beginning of the recording.
•END
positions the cursor at the end of the recording.
•PAGE UP
positions the cursor at the current starting position and adapts the plot view to show the remaining recording.
•PAGE DOWN
positions the cursor at the current end position and adapts the plot view to show the remaining recording.
Using two cursors
You can use both cursors and switch between them via the buttons inside the plot's tool bar.
Icon |
Tool tip |
Description |
|
Show Cursor 1 |
Activates the first cursor of the Plot window. Please click on a position inside the plot to set the cursor. |
|
Show Cursor 2 |
Activates the second cursor of the Plot window. Please click on a position inside the plot to set the cursor. |
|
Set active Cursor |
Click this button to toggle between the cursors. The button has three different states:
•Cursor 1 is selected •Cursor 2 is selected •Both cursors are selected |
Tip: If you click on the icon Use global timestamp functionality for this window ![]() inside the tool bar, the cursors will also be set at the same time stamp inside the trace window.
inside the tool bar, the cursors will also be set at the same time stamp inside the trace window.
Measurement values
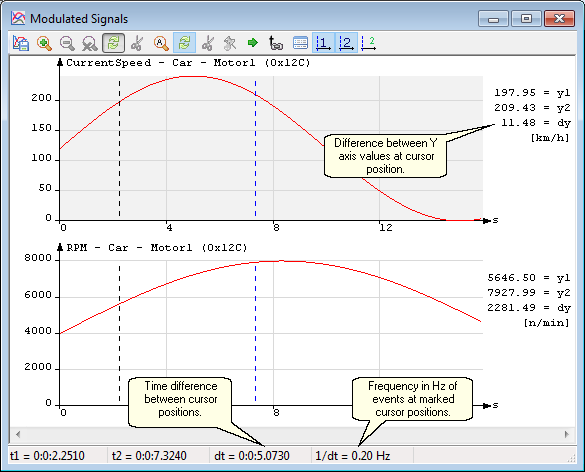
The text field to the right of the tool bar shows the respective measurement value the mouse points at. The status bar shows the current time stamp. To export the values of the selected signal, click the ![]() icon in the tool bar. If both cursors are used, the plot window will also display the difference between the cursors: The value difference on the Y axis is shown on the right side of the window; the time difference on the X axis is shown in the status bar. In addition, the status bar shows the frequency in Hz of periodically recurring events.
icon in the tool bar. If both cursors are used, the plot window will also display the difference between the cursors: The value difference on the Y axis is shown on the right side of the window; the time difference on the X axis is shown in the status bar. In addition, the status bar shows the frequency in Hz of periodically recurring events.
Zoom functionality
You can zoom into different areas inside the plot window. For this, CanEasy offers several methods. By clicking the Zoom all ![]() button in the toolbar, you can always zoom out completely.
button in the toolbar, you can always zoom out completely.
•Tool bar icons
Use the respective zoom icons (![]() ,
, ![]() ) in the tool bar to zoom into the current position of the active cursor.
) in the tool bar to zoom into the current position of the active cursor.
•+/- and CTRL + +/- numpad keys
The plus and minus keys in the numpad also zoom into and out from the current position of the active cursor. Simultaneously holding the CTRL key zooms the Y axis.
•Draw selection
Alternatively, you can press the left mouse button and draw a selection rectangle to enlarge the selected section.
•Mouse wheel and CTRL + Mouse wheel
Using the scroll function of the mouse wheel, you can zoom into the current mouse pointer position. Simultaneously holding the CTRL key zooms the Y axis.
![]() Autoscale
Autoscale
Activate the Autoscale function to automatically adjust the Y-scale to the minimum and maximum of the current signal values from the plot.
Context menu of a signal/graph
Name |
Description |
Show database menu |
Shows the context menu of the database signal |
Jump to database |
Selects the signal in the tree below the database |
Assign color |
Opens a color selection window where you can change the color of the plot line |
Show sample points |
Activates the display of the sample points. In this case, a point is drawn at the time of transfer. |
Settings |
Opens setting dialog to adjust properties |
Show scale |
Hides/shows the scale of the signal. Only has an effect if several signals are drawn on top of each other. |
Show graph |
Shows/hides the display of the graph in the plot window |
Move up |
Moves the graph up the tree |
Move down |
Moves the graph down the tree |
Context menu for resetting
Is optionally displayed if the settings of the graph differ from the settings of the group or plot panel.
Name |
Description |
Reset color |
Resets the color to the default color of the signal |
Reset show sample points |
Accepts the setting of the group or plot window |
Reset show scale |
Accepts the setting of the group or plot window |
Reset scale |
Accepts the minimum and maximum values of the signal |
Display of guides
Any number of horizontal auxiliary lines can be configured via the YLines the Plot-Signals attribute.
These are shown as dotted lines with the same color as the plot signal. They can be used, for example, to define areas in which the signal value should move.
Setting the plot thickness
By default, the signal is drawn with a width of 1 pixel.
If there are several signals on top of each other (overlapping mode), the selected signal is drawn with twice the width.
If a different thickness has to be used, this can be set using the PlotThickness and PlotThicknessSelected attributes.
Other settings
A dialog for editing the attributes can be opened via the context menu -> Settings.
Settings that overwrite the value of the parent are shown in bold type.
The value can be reset to the default value of the parent via the context menu.
In principle, settings at the top level (root) can be specified and overwritten by the elements below (plot graphs, groups, signals).